
What's new: ask Claude how your website is doing
Claude can now read your website's statistics: visits, contacts, top pages and where people come from. Ask it how the month went and what it would change to win more customers.
Until now, Claude could change your website but didn't know how it was doing. To find out whether a change had worked, you had to open the dashboard, look at the statistics and tell Claude yourself. Not any more: if Claude is connected to your website, it now reads the statistics directly.
The same figures you see in the dashboard
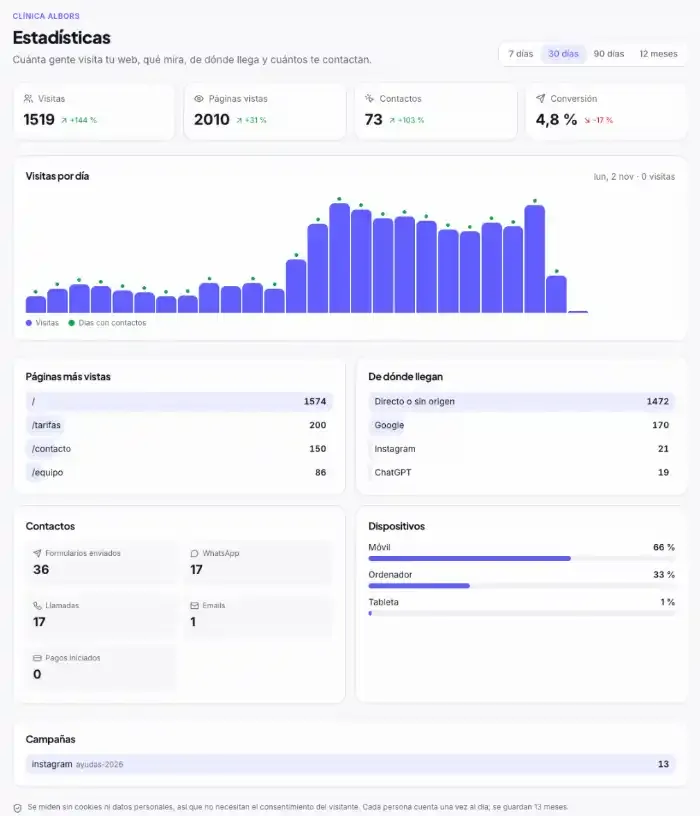
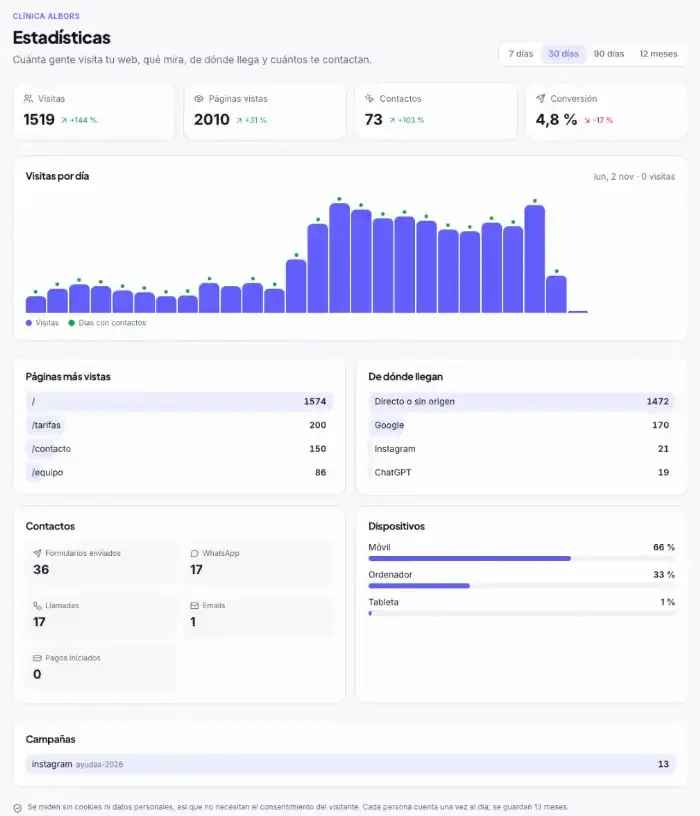
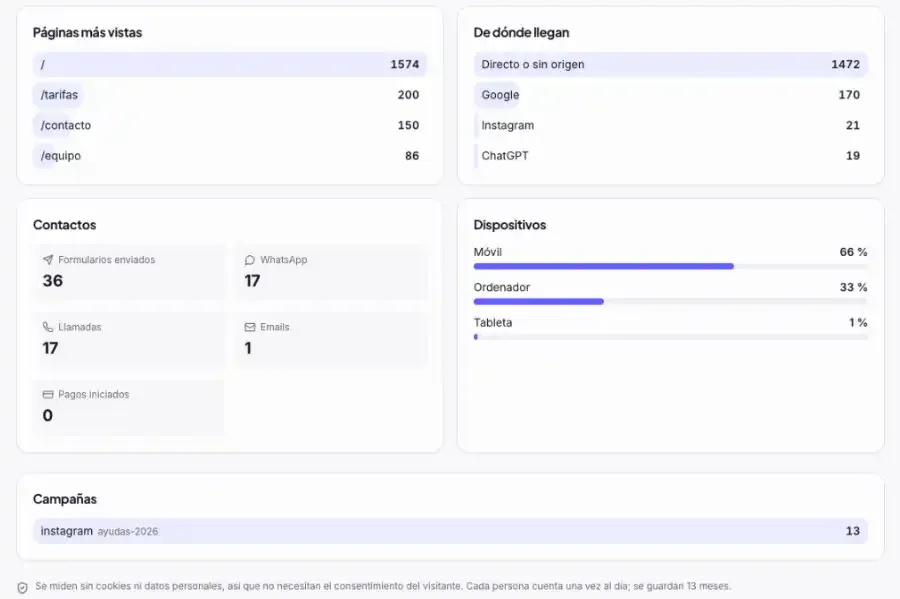
Claude sees exactly what the Statistics screen shows:
- Visits, page views and contacts: forms, calls, WhatsApp, emails, payments and bookings.
- Conversion: the share of visits that get in touch.
- The comparison with the period before, so you know whether things are going better or worse.
- The most visited pages, where people come from (Google, Instagram, ChatGPT…), your campaigns and devices.
You can ask about the last 7, 30 or 90 days, the last year or a specific month: “how did October go?”.
Your numbers, in a conversation
An example with a clinic's website: ask the way you would ask a person.
The month in figures
How did the website do in October compared with the month before?
Done (2/2)
- Read October's statistics
- Compared them with the month before
Very well: 1,595 visitors, more than double the month before (628), and 80 contact actions against 31. Conversion stays at around 5%.
Where they come from
Where do the visits come from?
Done (3/3)
- Checked where October's visits came from
- Split search engines, social media and AI assistants
- Looked at the campaigns
Most come in directly (1,531). Then Google (211), Instagram (30) and ChatGPT (21). The Instagram campaign “ayudas-2026” brought 15 visitors.
Ideas to improve
What would you change to get more appointments?
Done (2/2)
- Looked at the most visited pages
- Checked the devices visitors use
Prices is the second most visited page (237 visits): I'd put a clear button there to book an appointment. And since two in three visits come from a phone, a WhatsApp button at the top would help. Shall I prepare it as a draft?
From numbers to changes
The best part is that Claude doesn't stop at the data. With the figures in front of it, it can suggest specific changes and prepare them as drafts in the same conversation: a more visible button on the most visited page, clearer text where people arrive but don't get in touch, or an A/B test to check what works better.
Ideas to ask
- “How many visits and contacts did the website get this month?”
- “Compare October with September.”
- “Which pages work best?”
- “How many people come from Google? And from ChatGPT?”
- “How did the Instagram campaign go?”
- “What would you change to get more contacts?”
Your data, just as protected
Statistics are measured without cookies or personal data, so your visitors don't have to accept anything. And Claude only sees them if you can see them in the dashboard: whoever has no access to a website's statistics doesn't see them from Claude either.
How to start
If Claude is already connected, connect the clixxii connector again so it sees what's new. If it's your first time, see how on the Edit with Claude page.
Try it on your website
Build your website with AI and try it free for 14 days, no card needed.